A social media analytics API returns the metrics a network already holds about your own posts. Reading seven of them against their own references turns up a problem most comparison pages skip: the networks do not count the same object, so the tidy cross-network engagement rate on your dashboard is an average of things that are not alike.
Key takeaways
- Five networks limit your history five different ways, so the spans do not compare.
- LinkedIn ships a people-count and then ignores it in its own rate.
- Instagram withholds some metrics below 100 followers.
- Meta removed Page Insights metrics on every API version at once, so pinning did not help.
- Zilfu polls the last 90 days, which is its own version of this limit.
What does a social media analytics API actually return?
Whatever that network chose to count, under that network's name for it. There is no shared schema underneath, and the differences are not cosmetic. Pinterest surfaces SAVE and OUTBOUND_CLICK as ordinary organic metrics, while X's nearest equivalents, bookmark_count and url_link_clicks, sit in different tiers with different access rules. Threads reports quotes, which Pinterest has no analogue for at all.
The read surface is also gated differently from the write surface. Publishing is usually gated on an app audit, which you either pass or fail once. Analytics is gated on facts about the post and the account: who owns it, how old it is, and sometimes how big the account is. Meta states plainly that "Some metrics are not available on Instagram accounts with fewer than 100 followers" (Meta). No tool can lift that, whatever its own feature list says.
X splits its metrics into four sets rather than one. public_metrics carries retweet_count, quote_count, like_count, reply_count, impression_count and bookmark_count. organic_metrics and non_public_metrics add url_link_clicks, user_profile_clicks and engagements, and both need user-context auth on posts you own. A fourth set, promoted_metrics, covers paid activity (X).
Worth knowing: Zilfu sells one of the tools this page describes, so read it as an argument rather than a verdict. What we can do instead of asking for trust is quote each network's own reference and show the arithmetic, which is what the rest of this page does.
Which networks tell you how many people saw a post?
Three of the seven. Instagram and Facebook expose reach, and LinkedIn exposes uniqueImpressionsCount. The other four report appearances: X through impression_count, Threads through views, TikTok through view_count, and Pinterest through IMPRESSION (Pinterest, TikTok).
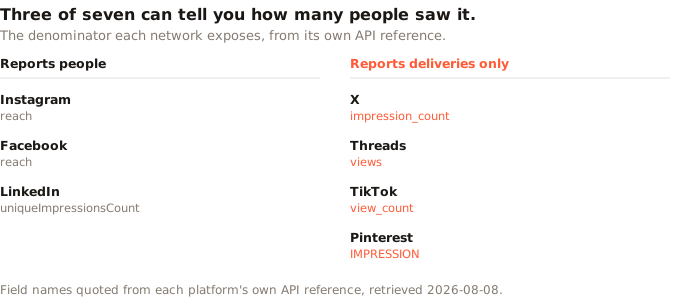
Meta's definitions make the distinction explicit at media level: impressions are the "Total number of times the Business Account's media objects have been viewed" while reach is the "Total number of unique accounts that have seen the media object" (Meta). One counts events, the other counts accounts. Meta has since renamed the event-counting field, which now arrives as views, so the definition outlived the label.
This is why a single engagement-rate column across networks misleads. Divide interactions by an appearance count and you get interactions per appearance. Divide by a people count and you get something closer to interactions per person. Both are legitimate engagement metrics; averaging them together is not. On the four networks that report appearances only, a people-based rate cannot be computed at all, so a tool showing you one on those networks has substituted a different denominator, whether or not it says which.
Our finding: Zilfu shipped this bug. An earlier build presented a unified
reachcolumn that was really impressions on some networks and views on others. The fix was not a better average, it was deleting the unified column and showing each network in its own units, with a definition attached to every number.
Why does LinkedIn ignore its own best number?
Because its engagement field predates the useful denominator sitting next to it. LinkedIn's schema defines engagement as "Number of organic clicks, likes, comments, and shares over impressions" (LinkedIn).
That is checkable against the sample response LinkedIn publishes on the same page. Its totalShareStatistics object gives clickCount 109,276, likeCount 52, commentCount 70, shareCount 0, impressionCount 14,490,816 and uniqueImpressionsCount 9,327, with engagement stated as 0.007549471334119487. Summing the four interaction fields gives 109,398, and dividing by impressionCount reproduces the stated figure to every digit LinkedIn prints.
So the LinkedIn analytics API is the one that hands you a people-counting denominator and then does not use it. If you want a rate divided by people on LinkedIn, you compute it yourself from the two fields in the same object. That is a small thing to know and an easy thing to get wrong, because the field is already called engagement and looks finished.
Two smaller quirks live in the same schema. likeCount "can become negative when members who liked a sponsored share later unlike it", because the like was not organic but the unlike is. And the endpoint returns organic statistics only: "Sponsored activity is not counted in this endpoint."
How far back can you actually read?
Between 30 days and a floor in mid-2024. But the five spans are not five measurements of one quantity, because each network limits history through a different mechanism. That is the same disease as the denominators, one layer down.
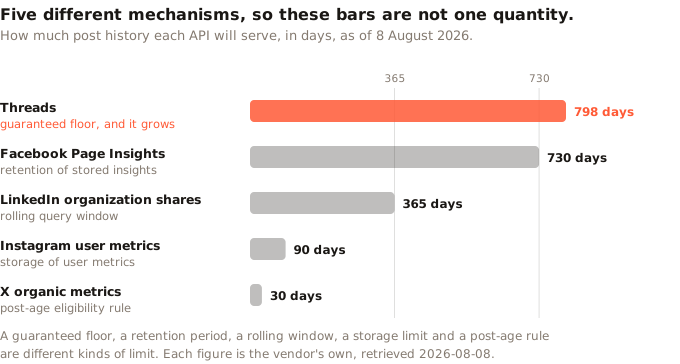
- Facebook sets a retention period. "Only the last two years of insights data is available" (Meta).
- LinkedIn sets a rolling query window. The endpoint "returns share data only within the past 12 months, using a rolling 12-month window" (LinkedIn).
- Instagram sets a storage limit. "User Metrics data is stored for up to 90 days" (Meta).
- X, whose Twitter analytics API heritage still shows in the field names, sets a post-age eligibility rule. Organic metrics are "only available for posts created" "within the last 30 days" (X).
- Threads sets a guaranteed floor. Its parameters "do not work for dates before April 13, 2024", and insights are "not guaranteed to work before June 1, 2024" (Meta).
Dividing the longest of those by the shortest would produce a number about nothing, so we have not. A guaranteed floor also behaves unlike the others: Threads reached 798 days of guaranteed history on the day this was published and gains one a day, while Facebook's two years stays two years. Its parameters accept dates from April 13, 2024, which would be 847 days, but Meta guarantees only from June 1, so 798 is the number to build on. The youngest API here already serves the longest history.
The practical consequence survives the caveat. Year-over-year is out of reach on X, Instagram and LinkedIn through the API alone, because 30 days, 90 days and a rolling twelve months all fail to reach the same month last year. If you want that chart, something has to store the numbers as they arrive, and that storage is invisible on a feature checklist.
Metrics get retired on a date, not on an upgrade
Your integration breaks, and it breaks on every API version at once. Meta's Graph API reference states that "By June 15, 2026, a number of the Page Insights metrics will be deprecated for all API versions" (Meta).
That phrasing is the part worth reading twice. API versioning normally protects you: you pin a version and changes land in the next one. A deprecation applied to all versions removes that protection, so pinning does not help and the failure arrives on a date rather than on an upgrade. That date has now passed.
Our finding: Zilfu was on the wrong side of that deadline. Facebook post insights had been failing against the removed metrics, and the fix was not a new hardcoded list. Our drivers now probe rejected metrics one at a time, keep the survivors for the rest of the run, and flag only the keys actually lost, so a metric that disappears is reported as unavailable with a reason rather than shown as a zero.
LinkedIn runs the same pattern on its own clock, having sunset Marketing Version 202507 with a migration notice on the share-statistics page itself (LinkedIn). Two of the seven networks, then, removed analytics surface within a year. Anything reading a named metric field should treat that field as temporary.
What does each network's analytics API give you?
One table, seven networks, the three columns that decide most integrations, alongside the network: the people metric if there is one, the appearance metric, and how far the history reaches.
| Analytics API | People metric | Appearance metric | History |
|---|---|---|---|
| Instagram analytics API | reach |
views |
90 days stored |
| Facebook analytics API | post reach |
see note | 2 years retained |
| LinkedIn analytics API | uniqueImpressionsCount |
impressionCount |
rolling 12 months |
| Threads analytics API | none | views |
guaranteed floor 2024-06-01 |
| X (Twitter) analytics API | none | impression_count |
30-day post-age rule |
| TikTok analytics API | none | view_count |
not published |
| Pinterest analytics API | none | IMPRESSION |
not published |
Four rows carry a caveat. Facebook has no appearance metric we are willing to name. Its post-level reach arrives as post_total_media_view_unique, and the metric Zilfu lost in June 2026 was that field's predecessor, post_impressions_unique, which was also a people count. Meta's notice names no metrics, so whether a plain appearance count survived is not something its reference establishes, and we would rather send you to this note than print a guess in the cell. Instagram now returns its event count as views rather than impressions, the rename noted earlier. The TikTok analytics API is thin here because TikTok's Display API is a content-display surface rather than an analytics product, and it publishes no retention figure. And the Pinterest analytics API matches TikTok on history while being the richest on intent: SAVE and OUTBOUND_CLICK are first-class organic metrics, where X's comparable figures are split: bookmark_count sits in public_metrics, while url_link_clicks needs user-context auth on a post you own.
Which analytics API should you build against?
It depends on which of two jobs you have, and the split is the same one that governs posting APIs. If you are embedding analytics for end users who each connect their own accounts, you need breadth and a quota that scales with customers. Ayrshare is the incumbent shape here, advertising "715 documented fields across 12 networks" (Ayrshare), covering networks Zilfu does not read at all, including YouTube, Bluesky, Reddit and Telegram.
If instead you are a team reading your own accounts, breadth matters less than whether the numbers are honest and whether a human can open them. Four questions separate the tools better than any feature grid:
- Does it name the denominator? If a rate is on screen, you should be able to find out which field sits underneath it without opening a support ticket.
- Does it distinguish absent from zero? A metric the network never reported and a metric that came back as nothing are different facts, and conflating them quietly rewrites your history.
- How long does it keep data the network will stop serving? That is the year-over-year question, and a feature grid rarely answers it.
- What happens on a deprecation date? Probe, or break.
For the write side of this decision, our social media APIs comparison covers quotas, rate limits and pricing across eight vendors, and the Ayrshare alternatives breakdown works through the billing units in detail.
Where Zilfu fits, and where it does not
Zilfu reads seven networks: Facebook, Instagram, LinkedIn, Pinterest, Threads, TikTok and X. Analytics are on every plan including Free, which covers two connected accounts without a card, and the same numbers come back over REST and over the MCP server so an agent can read them.
Collection runs every four hours and the dashboard shows the last collection time, because the alternative is implying a freshness the networks do not provide. Each network keeps its own units, with a plain-English definition on every metric, which is the direct result of the mislabelling described above.
Three honest limits, and the first one is the same limit this page has been describing. Zilfu polls the last 90 days of posts, so it inherits a version of the problem rather than solving it outright: snapshots accumulate from the day you connect, but posts older than that window are not being re-read. If your reason for buying is a year-over-year chart, ask exactly that question of any vendor, including this one.
The second is coverage. Zilfu does not read YouTube or Bluesky, so if either is central, the tools built for breadth serve you better. The third is shape: Zilfu cannot let a third party authorise their own account through the API, because account connection happens in the browser. That rules out the multi-tenant embedding case entirely. For a team reading its own accounts it is irrelevant; for a product embedding analytics for thousands of end users it is disqualifying, and it is better said here than discovered later.
If you want the numbers with their definitions attached, see what Zilfu reports per network.
Sources
- Meta, Instagram Platform Insights, retrieved 2026-08-08, https://developers.facebook.com/docs/instagram-platform/insights/
- Meta, Threads Insights, retrieved 2026-08-08, https://developers.facebook.com/docs/threads/insights
- Meta, Graph API Insights reference, retrieved 2026-08-08, https://developers.facebook.com/docs/graph-api/reference/v23.0/insights
- LinkedIn, Organization Share Statistics, retrieved 2026-08-08, https://learn.microsoft.com/en-us/linkedin/marketing/community-management/organizations/share-statistics
- X, X API fundamentals: metrics, retrieved 2026-08-08, https://docs.x.com/x-api/fundamentals/metrics
- TikTok, Display API get started, retrieved 2026-08-08, https://developers.tiktok.com/doc/display-api-get-started
- Ayrshare, Social Media Analytics API, retrieved 2026-08-08, https://www.ayrshare.com/social-media-analytics-api/
- Pinterest, API v5 reference, retrieved 2026-08-08, https://developers.pinterest.com/docs/api/v5/