— Analytics

Analytics on every plan.

Every connected account in one dashboard — what reached people, what they loved, and which channel did the work. No upgrade required, not even from Free.

Free plan · No credit card required

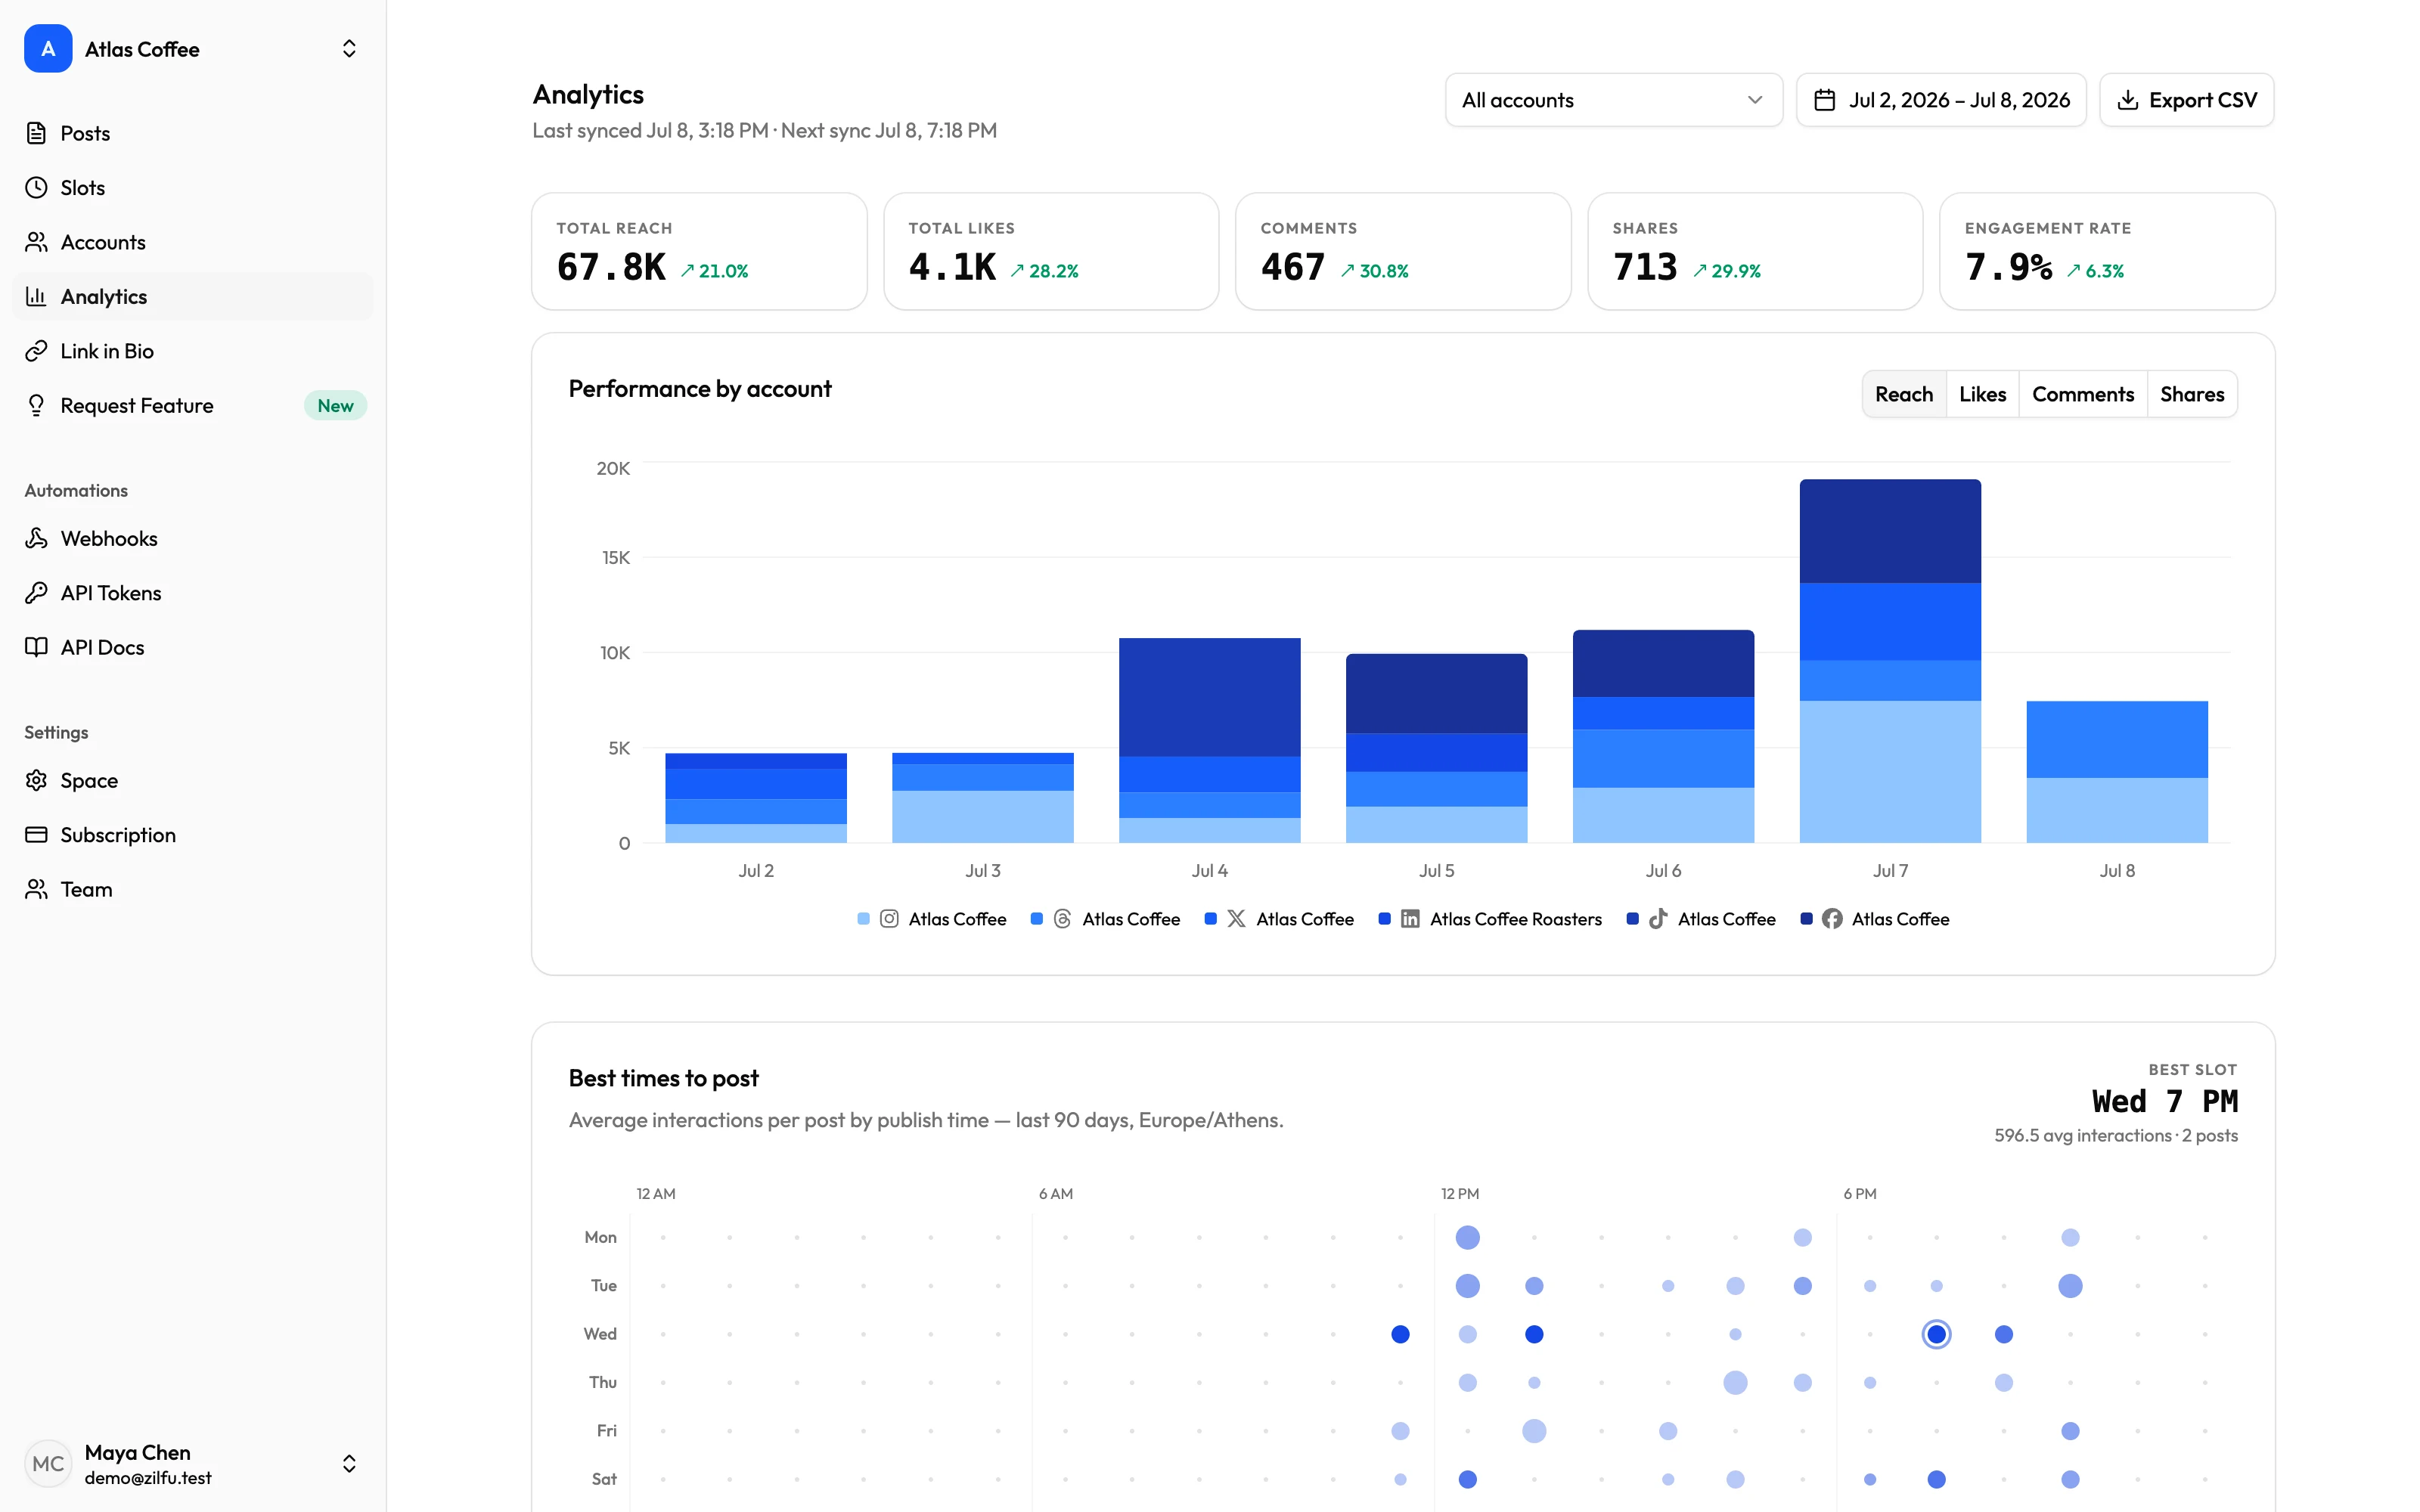
Zilfu analytics dashboard showing reach, likes, comments, shares, and engagement rate with period-over-period change, a daily chart split by account, and a best-times-to-post heatmap
  • Included on every plan, even Free
  • Every account in one dashboard
  • Best times, top posts & follower growth
  • CSV export for client reports
01 See

Every account. One picture.

Stop hopping between native dashboards — reach, likes, and engagement across all your channels, in one view.

One unified dashboard

Reach, likes, comments, shares, and engagement rate for the period, across every connected account.

Split by account

One daily chart, each day divided by account — hover for each account's exact numbers.

Compared fairly

Views, impressions, replies, reposts — every platform's wording normalized so channels compare on equal footing.

Momentum, built in

Every summary card compares against the previous period, with an up-or-down indicator.

Engagement rate, computed

Likes, comments, and shares divided by reach — no mystery formula, any period you pick.

Follower growth

Daily follower counts, plotted per account — growth and dips visible at a glance.

02 Focus

Find what's working.

Narrow the whole dashboard to the question you're asking — then double down on what your audience loves.

Date presets

Last 7, 30, or 90 days in one click, or pick a custom range from the calendar.

Account filter

Check any combination of accounts — cards, chart, and post grid all narrow to your selection.

Any metric on the chart

Flip between reach, likes, comments, and shares — normalized across platforms.

Per-post cards

Media, account, publish date, and the metrics specific to that platform — no clutter.

Best times to post

A weekday-by-hour heatmap finds your best slot — backed by real post counts, not one lucky hit.

Top posts, ranked

Your best posts for the range, scored by interactions — see what worked and make more of it.

03 Included

On every plan. Even Free.

Analytics isn't an upsell here — connect an account and the numbers start flowing on their own.

Free means free

The full dashboard on the Free plan — no upgrade, no trial clock.

Syncs itself

Data refreshes every four hours, with the last and next sync shown on the dashboard.

Zero setup

Connect an account and metrics start collecting — nothing to configure.

Beside your calendar

Numbers live next to your queue and posts — no second tool, no tab-switching.

Platform-true metrics

Saves on Instagram, quotes on Threads — each network reports what it actually measures.

CSV export in a click

Every post's metrics for your range and accounts — ready for spreadsheets or client reports.

— FAQ

Analytics, asked and answered.

Yes. Analytics are on every plan, including the Free plan — no upgrade required.

Reach, likes, comments, shares, and engagement rate on the dashboard — each compared against the previous period — plus follower growth, a best-times-to-post heatmap, top posts, and per-post metrics specific to each platform. Instagram accounts connected before analytics arrived need a one-click reconnect to start collecting metrics.

Automatically every four hours; the dashboard shows exactly when the last sync ran and when the next one is due.

Yes. The daily chart splits each day by account, and the account filter narrows the whole dashboard — cards, chart, and post grid — to any combination of accounts.

Yes. The per-post grid shows each post's media, account, publish date, and its platform's own metrics — and opens the original post on the platform in one click.

Platforms name things differently — views, impressions, reach, replies, reposts. Zilfu normalizes them into reach, likes, comments, and shares on the chart so accounts are compared on equal footing, while per-post cards keep each platform's own metrics.

Yes. A weekday-by-hour heatmap averages the interactions your posts earn at each publish time over the last 90 days, and calls out your best slot backed by real post counts — so one lucky post doesn't skew the advice. Times show in your workspace timezone.

Yes. A daily chart plots each account's follower count from the moment analytics sync starts — on Instagram, Threads, Facebook, Pinterest, X, and LinkedIn company pages.

Yes. Export every post's metrics for the selected date range and accounts as a CSV with one click — ready for spreadsheets or client reports.

Know what's working.

See what reached people and what they loved, across every account — on every plan, including Free.